Investigation of 3D-printed amorphous polyether ether ketone (PEEK) fatigue life
Predicting fatigue life of 3D-printed PEEK (polyether ether ketone) is fundamental since functional parts such as medical or mechanical components are subjected to repeated loads over time. The functionality of such components could be compromised by fatigue failures that are usually due to a high number of load cycles with magnitude significantly lower than the static strength limit. Therefore, knowing material’s ability to withstand repeated cycles of mechanical stress is essential to ensure the safety of such devices.
Goal: aim of this study is to predict the 3D printed PEEK fatigue life using the Basquin model, which relates the material’s lifetime in cycles N to the applied stress amplitude S, through the fatigue strength coefficient a and the fatigue exponent b:

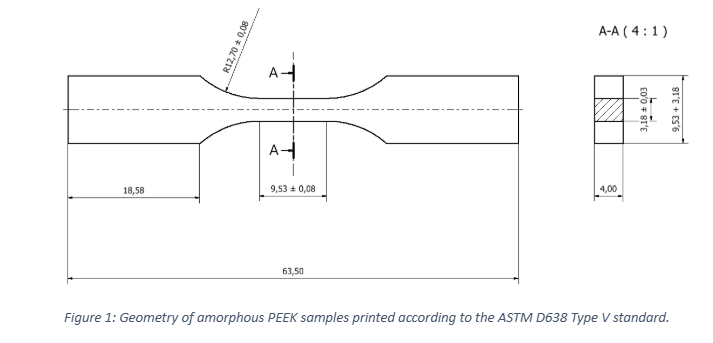
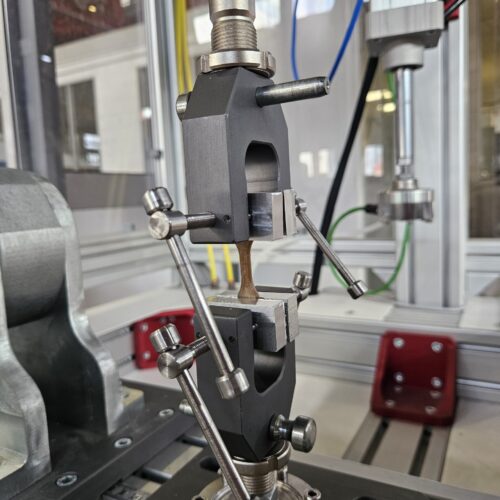
Methods: amorphous PEEK dogbone-shaped samples (see Figs. 1 and 2), with dimensions according to the ASTM D638 Type V standard, were printed using the FFF (Fused Filament Fabrication) Apium P220 3D printer.


Figure 2: Amorphous PEEK sample.
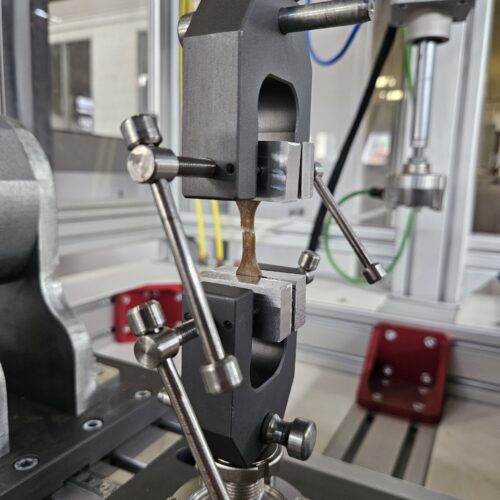
The samples were initially subjected to uniaxial tensile tests to determine their ultimate strength (Fig. 3), which served as a reference for the fatigue tests. Both tensile and fatigue tests were conducted by L. Ruccolo, as part of his master’s thesis, and supervised by B. Rossetti using the Litem BYC 200 machine available at the Department of Civil Engineering and Architecture (DICAR) of Pavia University.
The printing profiles for amorphous PEEK samples were developed and optimized with the fundamental contribution of S.Serioli and F.Rotini.
The research activity was managed by G. Alaimo,S. Marconi and F. Auricchio.


Figure 3: left, test setup; right, a PEEK sample after failure.
The calculated average ultimate tensile strength across all samples was found to be 74 MPa. Based on this value, fatigue tests were carried out according with the ASTM D7791 standard. Specifically, the percentage values of 85%, 80%, 75%, 65%, 55%, and 45% of the ultimate tensile strength were applied during the fatigue tests, with three samples tested for each percentage value. Tension-tension fatigue tests were then performed under force control, with the minimum force set at 0N for all tests, the maximum force set at the respective percentage value, and a frequency of 6 Hz. The test was interrupted after specimen fails or after exceeding the limit of 2.000.000 cycles.
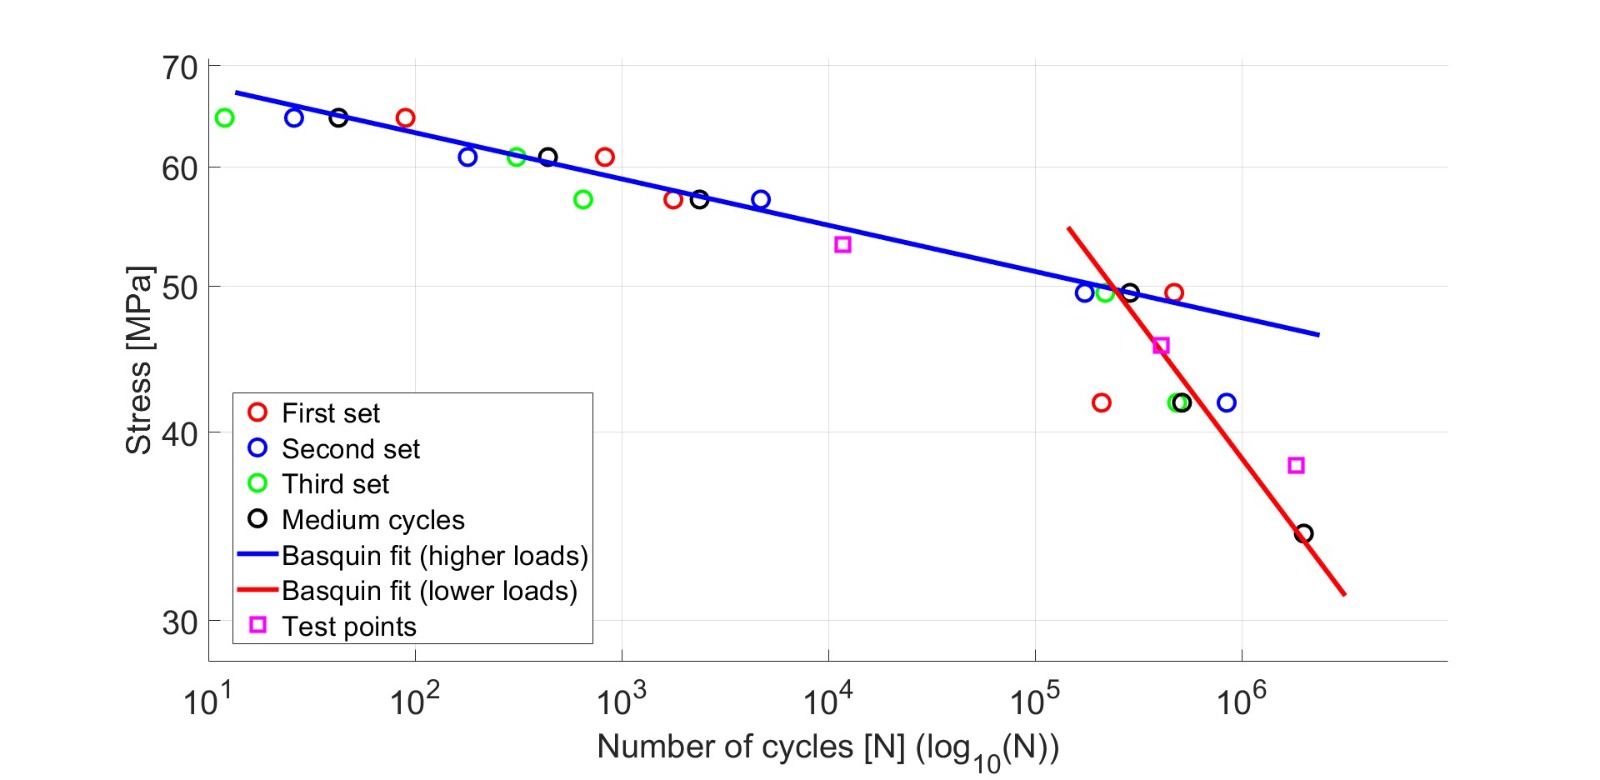
Results: following the Basquin model, the S-N (Stress-Number) curve was built along with linear regression for both plastic (higher loads) and elastic regions (lower loads), as shown in Fig. 4.

Figure 4: S-N curve obtained using the Basquin model, along with linear regression for both the plastic and elastic regions.
To evaluate the model’s accuracy, the MSE (Mean Squared Error) was calculated as the average distance between observed and predicted values. For the plastic and elastic regions the MSE is equal to 0.0030 and 0.0154, respectively. These results show the model’s reliability in representing 3D printed PEEK fatigue behavior.

