
Numerical simulation of 3D printed FFF parts through G-code derived geometry
Simulating 3D printed parts obtained through Fused Filament Fabrication (FFF) technologies presents a significant challenge due to the lack of tools to accurately reconstruct the submillimeter inner geometry resulting from both infill and perimeter strategies. Researchers at ProtoLab, F. Rotini and S. Marconi addressed this challenge by developing an in-house MATLAB code.
This code generates precise interior (infill) and exterior (perimeters) geometries for any FFF components based on G-code instructions.
The underlying concept originates from the original idea of G. Alaimo and A. Cattenone, and the project received supervision and support from Prof. F. Auricchio.
Methods
Ten beam samples were 3D printed and tested by B. Rossetti and F. Rotini using the Litem BYC 200 machine, available at the Department of Civil Engineering and Architecture (DICAR) of Pavia University.
The experimental setup is shown in Figure 1a. To run the test, a total displacement of 4 mm was applied to the specimen midpoint at a deformation rate of 1.7 mm/min according to the ASTM D790 standard. The deformed configuration of a beam sample is shown in Figure 1b.

Figure 1a: three point bending test experimental setup

Figure 1b: beam deformed configuration
Figure 2 shows the averaged load-displacement curve of the experimental test, along with the 98% confidence interval.
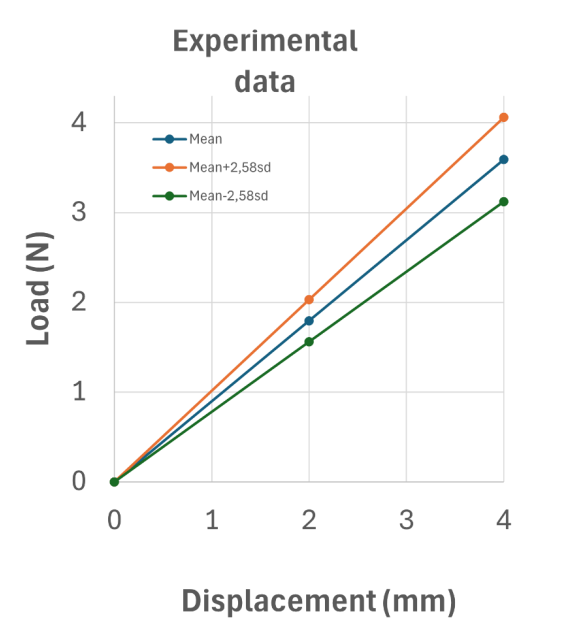
Figure 2 Average load-displacement curve, along with the standard deviation
The geometry of the samples was reconstructed through the proposed Matlab code, whereas the G-code visualization through slicing software is shown in Figure 3
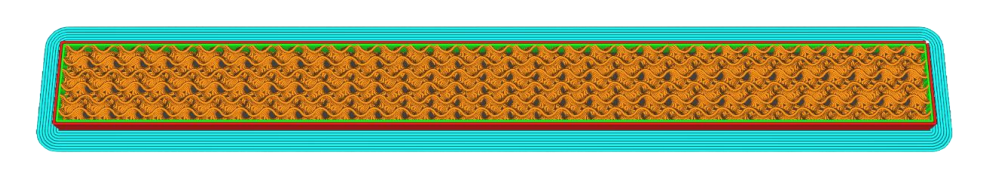
Figura 3: G-code geometry reconstruction
The experimental three-point bending test has been replicated through the numerical simulation carried out in Ansys, with frictionless contact and large deformations. The material model is linear elastic, with material parameters as per manufacturer’s data sheet. Set-up and meshed geometry are shown in Figure 4 and Figure 5 whereas total deformation and Y – normal stress resulting from the FE analysis are shown in figure 6a and 6b, respectively.
Figure 4 Numerical simulation set-up
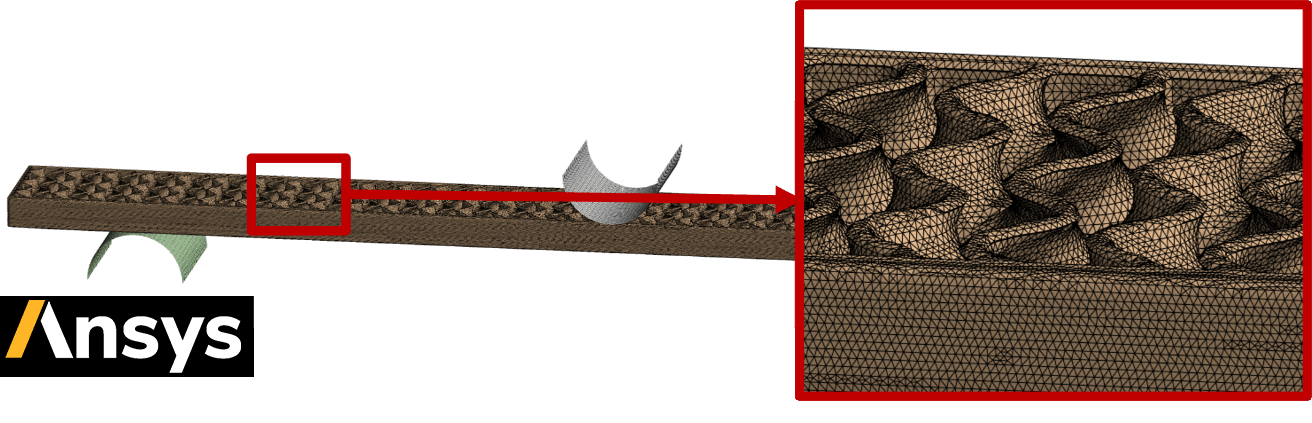
Figure 5 Meshed geometry with details
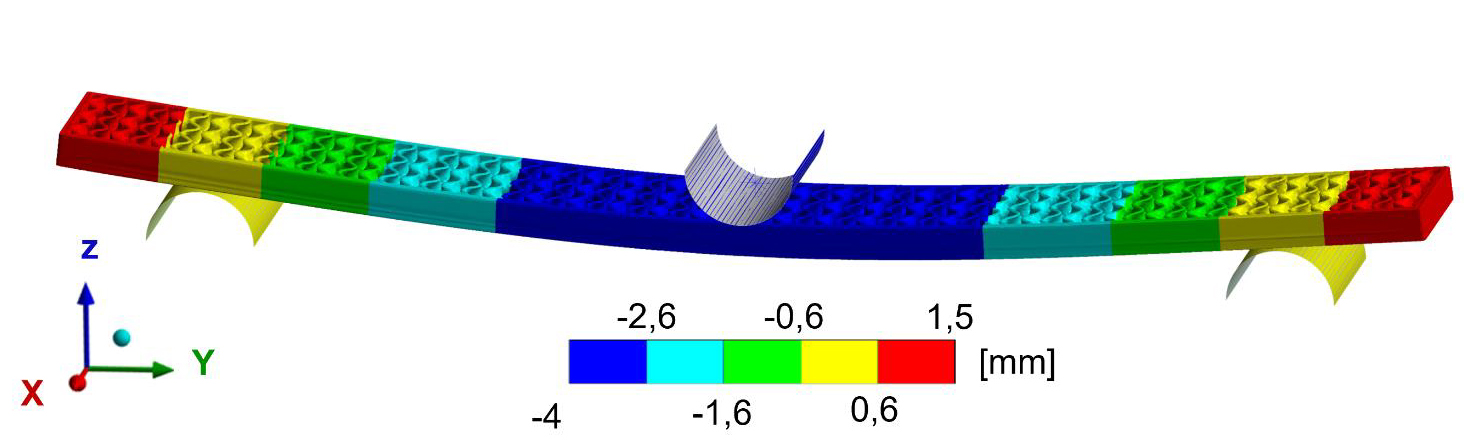
Figure 6a
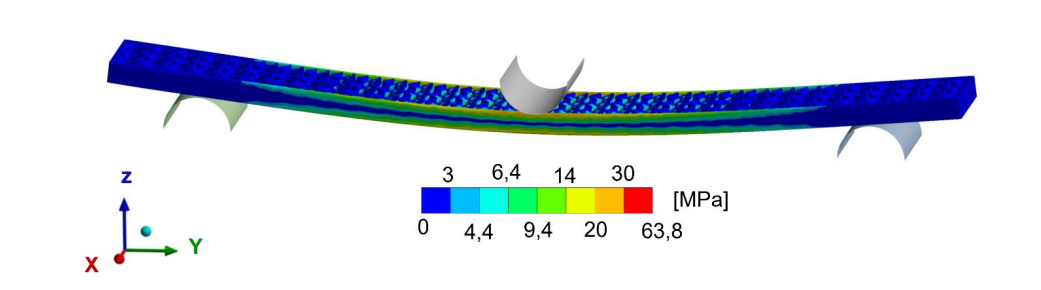
Figure 6b
Results
Experimental and numerical data comparison is shown in Figure 7. The analysis of the figure shows that the numerical data falls within the confidence interval of the experimental data. Such an evidence allows us to conclude that the geometry reconstruction is accurate enough for a reliable prediction of the mechanical response of the gyroid beam samples.
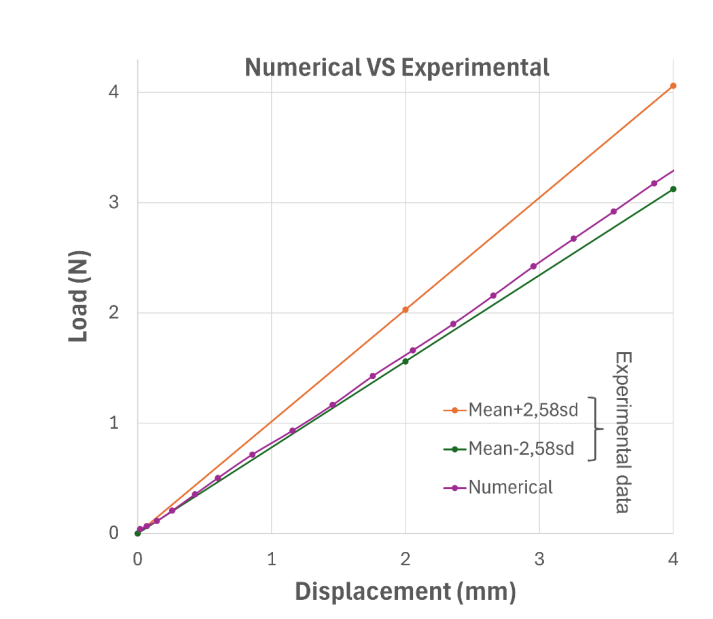
Figure 7 Comparison between experimental and numerical data